We know how much energy developers pour into debugging bugs and diagnosing performance in .NET. That’s why we’ve doubled down on making the debugging and profiling experience in Visual Studio not just easier, but genuinely enjoyable meeting you exactly where your real work happens. The same tools you rely on are now able to keep up with you, identify issues more quickly, offer context-smart fixes, and help you move from asking “why is this broken?” to “oh, I see and here’s the fix” in a fraction of the time.
So, if you’re ready to spend less time stuck in the debugger and more time building, let’s see what Copilot can really do for your .NET diagnostics game.
Copilot Debugging Toolbox
Here’s what’s new in your Copilot Debugging feature set:
Breakpoint & Tracepoint Copilot Suggestions
Skip the manual setup. Copilot analyzes your current context and suggests exact conditional expressions or tracepoint actions that target the right spot in your code. Read More.
Breakpoint Troubleshooting
With Copilot, you can now troubleshoot non-binding breakpoints instantly. Just ask, and Copilot will walk you through the likely causes whether it’s mismatched symbols, incorrect build configurations, or optimized code paths and guide you toward a fix without the usual trial-and-error. 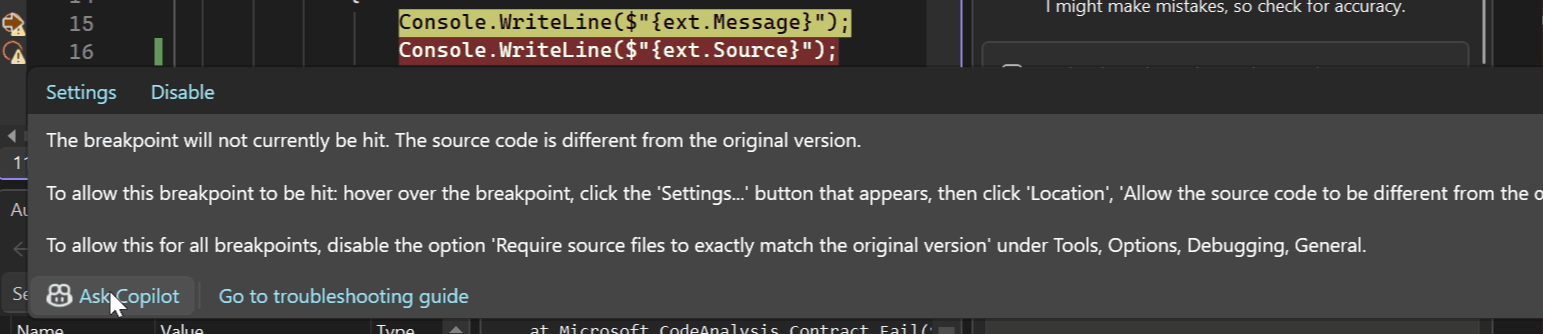
IEnumerable Visualizer with Copilot-Assisted LINQ Queries
Inspect massive collections without getting lost. The IEnumerable Visualizer renders your data in a sortable, filterable tabular view, while Copilot can generate or refine LINQ queries based on natural language prompts. Debugging a filter issue? Just ask for the LINQ that surfaces the problematic rows, Copilot writes it for you, live. Read More.
LINQ Query Hover with Copilot
Hover over any LINQ statement while debugging and Copilot will explain what it’s doing, evaluate it in context, and highlight potential inefficiencies or logic mismatches all without leaving your editor. Read More.
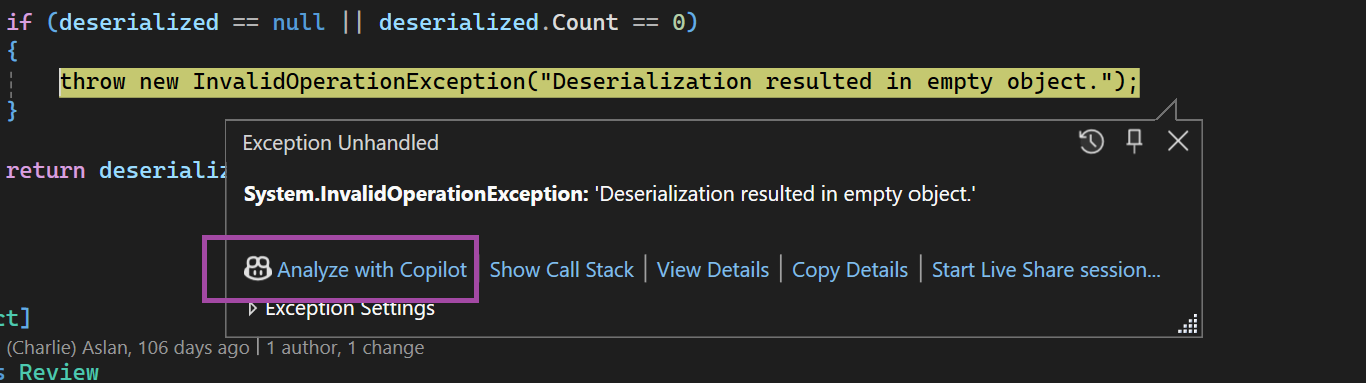
Exception Assistance with Copilot
When an exception hits, Copilot does more than show a stack trace. It summarizes the error, identifies the likely cause, and offers targeted code fix suggestions. Whatever the exception type, you’ll quickly understand what went wrong and how to resolve it, saving time and reducing frustration. Read More.
Variable Analysis with Copilot
Hover over a variable in DataTips, Autos, or Locals and click the Copilot icon to see the potential reasons for unexpected results. Debugging becomes less guesswork, more detective work with a clear trail of evidence. Read More.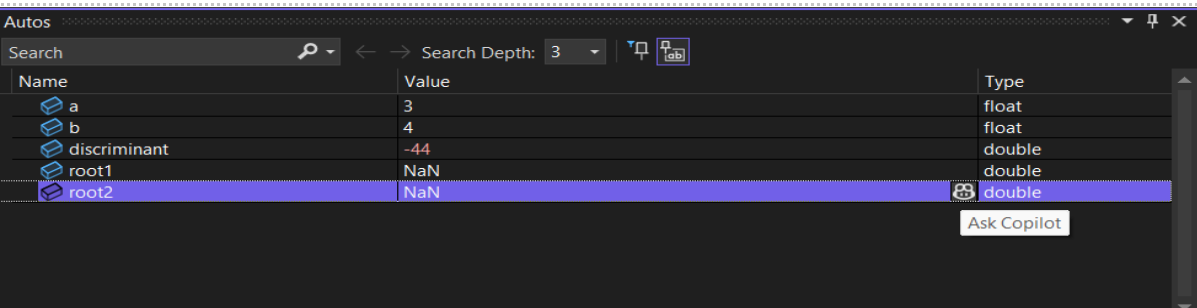
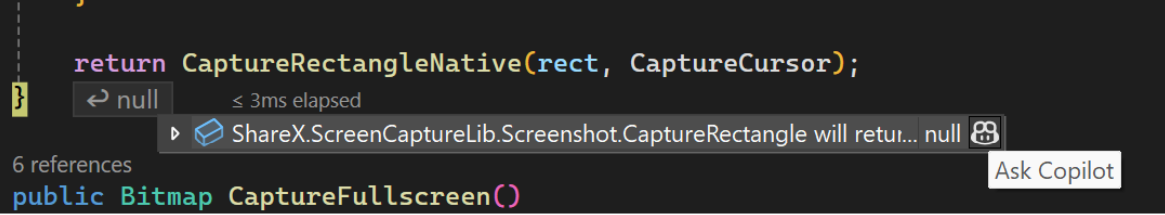
Return Value Analysis with Copilot
See exactly what your methods return inline, in your code while you debug. And then with Copilot you can validate and get explanations for these values in context, helping you confirm correctness or pinpoint where things start to drift. Read More.
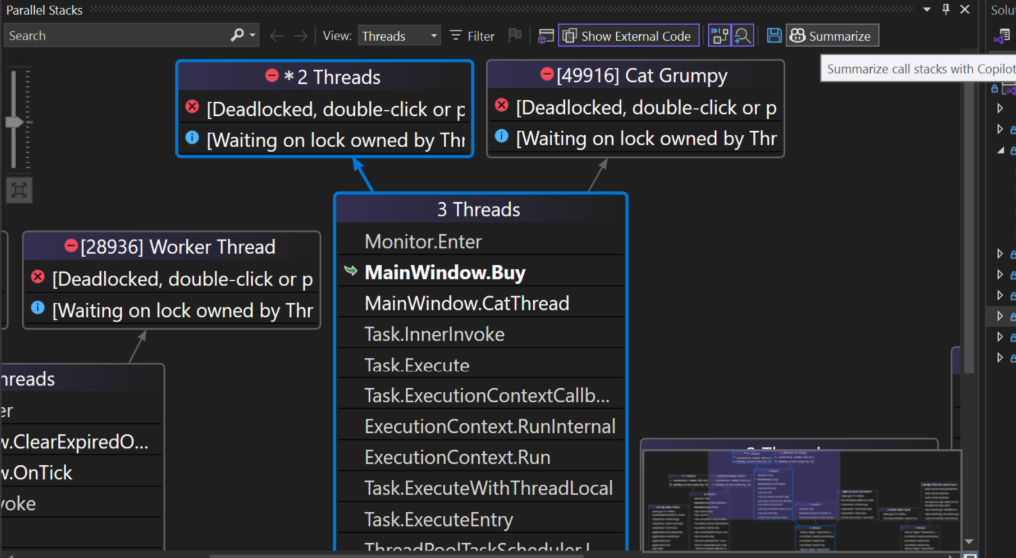
Parallel Stacks Deadlock Analysis, Auto Summaries & Insights
Untangle complex async and multithreaded code in the Parallel Stacks window. Copilot generates thread summaries for each stack, while its Summarize option gives you insights for application state, possible deadlock, hangs and crashes so you can diagnose issues without combing through hundreds of frames. Read More.
Copilot Profiling Toolbox
Here’s what’s new in your Copilot Profiling feature set:
Auto Insights in CPU usage, Instrumentation and .NET allocation tool
Quickly see where your application is using the most CPU with Copilot Auto Insights. The CPU usage summary highlights hot paths, high-usage functions, and potential performance bottlenecks, while Auto Insights pinpoints the exact performance issues you need to tackle.
For deeper analysis, the Ask Copilot button lets you query specific insights and provides actionable guidance from optimizing loops to reducing allocations and improving overall efficiency all directly within the debugger. Read More
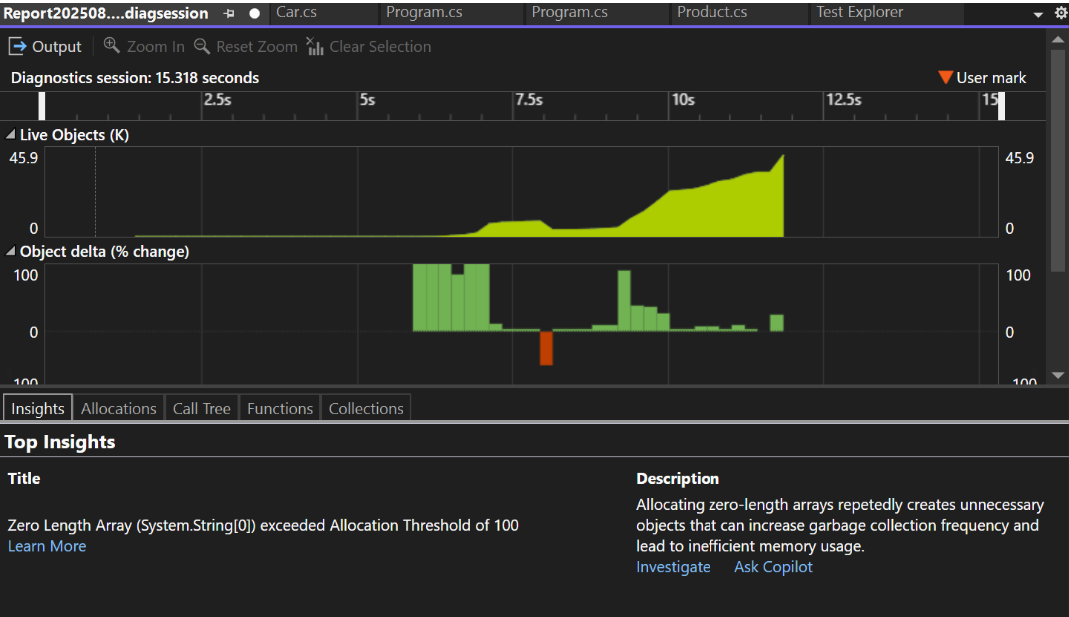
A similar Auto Insights experience is also available in the Instrumentation tool and the .NET Allocation tool, with a focus on identifying zero-length array allocations.
With the Profiler, this is just a snapshot of what Copilot can do, our upcoming, larger agentic experience will help you understand and fix performance issues without needing to be a profiling expert. And it doesn’t stop there: more Copilot-assisted guidance is on the way, making it even easier and faster to navigate the full suite of profiling tools available in Visual Studio.
The Bottom Line
This isn’t about replacing your debugging skills, it’s about cutting out the repetitive, tedious work so you can focus on what really matters: solving problems and shipping features. Copilot surfaces the right information in context, exactly when you need it.
Think of it as having a knowledgeable pair programmer inside your Visual Studio one that helps you move faster, understand code more clearly, and catch issues before they slow you down.
Want to see these features in action? Here are a few suggested videos with practical demos:
Fuel Your Fixes: Visual Studio Debugging, Powered by Copilot
Make Software Faster with VS Profiler & Copilot
The post Copilot Diagnostics toolset for .NET In Visual Studio appeared first on .NET Blog.